July 31, 2019

Microsoft Azure Portal uses wrong user agent for New Edge 77. It uses Chrome 77.0


Our team at Microsoft tried to get the latest data of the browser percentage from our customers in  Azure Portal. However, I don’t see the ‘New Edge” in client_Browser column.

Does Azure capture browser usage for the new Edge?  The answer is no at this moment.

It is easy to repro:

1. Use the new Edge (Edge Dev: Version 77.0.223.0) to browse the Prod/PPE/DEV portal  many times.

2. Go to Azure portal-> Application insights- Logs (Analytics).

3. Query the client browser.

4. Chrome 77.0 is showing up , but it is not correct.  It should be Edge 77.0

We know that the new Edge is based on Chromium. It is not Chrome 77.0. It is supposed to be Edge 77.0.

Here is the query. 

pageViews

 | where client_Browser =='Chrome 77.0'
 | project client_Type, client_Browser, client_OS , timestamp , client_City   
 | limit 10


pageViews
 | project client_Type, client_Browser, client_Model, client_OS ,client_City
 | summarize count() by client_Browser


I don't see "New Edge" appear.  I sent the email to Azure Monitor DL and one guy opened the bug for me. Hopefully this issue can be fixed soon.

July 24, 2019

How to fix the error of VsTest Test Platform folder was not found in cache in Azure Pipelines?


Today I noticed that the log in UI Automation Tests had the error in the pipeline: VsTest Test Platform folder was not found in cache.


After looking into this interesting issue, we were not sure why Visual Studio test platform installer was disabled for this release. 


After we enabled it and re-ran the tests, all tests passed.

July 20, 2019

How to run all tests except one test in Azure Pipelines?


Last Thursday, I noticed that one UI automated test failed in Canary in Azure Pipelines. After looking into this issue, it happened in all environments.  

Previous situation: When we hit the portal, marketing landing page appears. Clicked Sign In button. The login page was open in another tab.

Current situation: When we hit the portal, marketing landing page appears. Click Sign In button. It is remaining in the same tab and is redirected to the login page.

This change was made by our marketing team and it looks more user-friendly. But it made one UI automated test failed and it was not the shipping blocker.

I fixed it in Dev. In this case, we do not want to re-deploy test code to PPE-Canary again because it is really time consuming.

I talked to my release engineer that we should exclude this test in the specific release pipeline for reporting purpose since everyone knew it. He totally agreed to what I was saying.  

In test filter criteria, we added the following one and re-ran the tests. All tests passed.


July 16, 2019

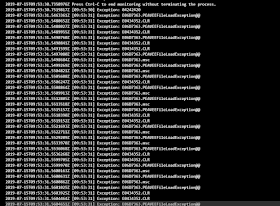
How to let hundreds of E0434352.CLR errors disappear in Azure Pipelines?


We have noticed that when running UI automation tests in the Azure Pipelines, hundreds of E0434352.CLR errors appeared in the log. They looked so ugly. Finally we found it is still a bug in Azure Devops.


After doing some research, our release engineer unchecked “Collect advanced diagnostics in case of catastrophic failures” and triggered the tests again. All E0434352.CLR errors in the log were disappeared.


June 24, 2019

How to debug the Selenium test failures against React app in Azure Devops release pipeline?


I have been working on UI Automation Tests against React App with Selenium WebDriver in my current Microsoft Project since last December, 2018. 

Our team sets up the release pipelines in Azure Devops and runs the tests including our Selenium UI Automation tests.


Sometimes some UI Automation tests failed in Azure release pipeline, but passed in my local machine. How to debug the failed tests is the challenge?

Here are my lessons learned.

Since we use Azure Pipelines Hosted VS2017 image to run the tests, we need to know the setup details of hosted VS 2017.


Chrome Driver:


If your Chrome browser is automatically updated to the latest one in your local machine, it does not mean Azure Devops will use the latest one. It takes 1-3 months to update the latest version in Azure Devops.

I remember when Chrome was automatically updated to v74 in my machine, Azure Devops still used Chrome v71. The tests passed in v74, but failed in v71. Therefore, downgrading the right Chrome version to mimic the one in Azure Devops is more important.

Resolution: 1024*768

Azure Devops is using 1024*768 resolution by default to run UI automation tests.  It is not possible for us to change the resolution in Azure Devops.

Some people in the online forum mentioned screen resolution utility task and they implemented it in the release pipeline to fix the resolution issue.

However, in our team at Microsoft , we do not have direct control over what DevOps tasks are installed and there is an approval process for onboarding. I also submitted the request, but declined unfortunately.

Therefore, if the tests fail in the release pipelines, the easiest way is to change the resolution to 1024*768 in the local machine and run the tests. Most of the time I can repro the issue.


Adding more logs in the tests:

I remember when I looked at the test failures in the release pipeline for the first time, I did not know why the tests failed because there was no log information. Therefore, I added more in each test. It is easy to track which step causes the test failure.

Set maximum # of attempts =3.
I asked the Azure Devops engineer to set maximum # of attempts =3. The idea is that UI Automation tests are not as robust as API tests. If the test fails 3 times, it means there is something wrong with this test.(Please see this post: Setmaximum # of attempts for Selenium UI automation tests in Azure releasepipeline)

Add wait time when the page loads to wait for elements to appear
Sometimes UI automation tests run too fast to capture the UI element name. Therefore, using WebDriverWait to add the wait time is a good idea.

WebDriverWait wait = new WebDriverWait(driver, TimeSpan.FromSeconds(seconds));

Selenium Simple Click is not really reliable in React App in Chrome

When Chrome was upgraded from v71 to v74, a lot of UI automation tests against React App failed because the element.Click() was not working properly. There was no error because clicking the element had no response. I filed the bug in Chromium project , but they closed bug with no repro.

In the latest Chrome version, Element.Click() is not working properly in React App. Using Actions class to hover over element is not always working either. The only way I found out was that using IJavaScriptExecutor() class handled the click easily. It took us one week to fix all failed tests and it was the great achievement!

Next time if you would like to debug the test failures in Selenium against React App in Azure Devops, the information above may be helpful to you.

June 21, 2019

Set maximum # of attempts for Selenium UI automation tests in Azure release pipeline


Our Azure Devops engineer set up the Selenium UI Automation Tests in the Azure release pipeline. I asked him to set maximum # of attempts =3.


The idea is that UI Automation tests are not as robust as API tests. If the test fails 3 times, it means there is something wrong with this test.

Maybe there is a bug.

Maybe developers update the UI element names without letting me know.

Maybe there is the resolution issue (1024*768) in Azure devops.

Maybe there is the account conflict when doing the parallel runs.

When my colleagues see the Pipeline tab , they always feel confused. Why it shows the error? But in the Logs tab, it shows succeeded. So the test result should show error or succeeded?


I always explain that it is the design issue in the release pipeline. We set maximum # of attempts =3. For example, this test has been run 2 times and it shows the Test Run Failed messages twice. But the final test result is succeeded.

Finally they understand they need to look at succeeded text.

June 13, 2019

Fixed the Visual Studio 2017 IDE Error when trying to use debug coded web performance test.


Today I used the Visual Studio Coded Web Performance test to record the web request and I generated the code to coded.cs file.

The interesting part was that when using 'debug Web Performance test' feature, the Visual Studio IDE showed the following error.


After looking into this issue, it is defenitely the product bug. How to fix it?

Go to Local.testsettings. In General Tab, just change it to “Run tests using local computer or a test controller” and you are all set.


March 5, 2019

How to update the time zone in Azure Devops?


I started my new job last December and I got the chance to learn something about Azure Devops (Visual Studio Online).

Today I notice one thing: If I created the pull request, after team members approved it, I marked it Complete. Why was the timestamp set to UTC time zone?


After looking into this interesting issue, I finally find out one fact: the default time zone is set to UTC in Azure Devops. If we would like to change it to pacific time, we can just go to this link and update the time zone to Pacific Time.


 After updating it and going to my pull request again, the time zone has been updated to Pacific Time.